Hello, I'm
Kirandeep Marala
Analytics Engineer
Building Pipelines That Power Data-Driven Decisions.

Hello, I'm
Analytics Engineer
Building Pipelines That Power Data-Driven Decisions.
I'm an Analytics/Data Engineer with 3+ years of experience owning the full data lifecycle — from ingestion to serving. I build production-grade ELT pipelines, semantic data models, and transformation layers on Microsoft Fabric and AWS. Proficient in SQL, Python, and PySpark, I've architected automated data workflows processing thousands of records daily, enabling self-serve analytics for cross-functional teams across edtech and hospitality domains.


SQL
Python
PySpark
Microsoft Fabric
Delta Lake
Power BI
DAX
Snowflake
AWS Lambda
Data Modeling
Star Schema Design
ELT/ETL Design
Git
REST APIs
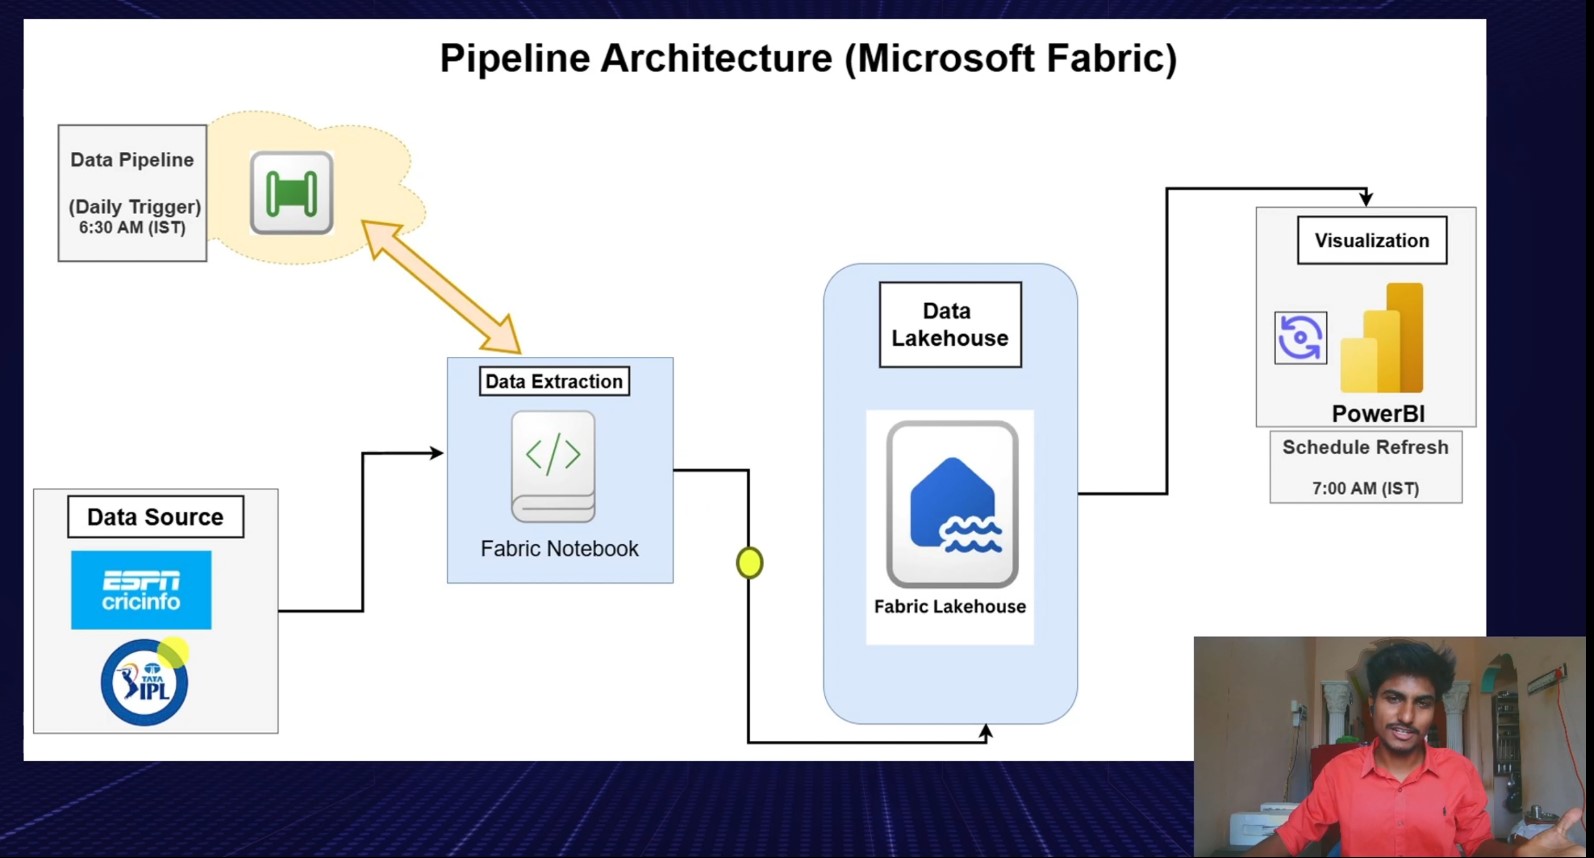
Welcome to the IPL 2025 Analytics project! This is a complete end-to-end data engineering and analytics pipeline, powered by Microsoft Fabric, BeautifulSoup, and Power BI. The project fetches daily IPL 2025 match data from the web, processes and stores it in the Fabric Lakehouse, and presents it via insightful and interactive Power BI dashboards.
End-to-End Data Engineering Workflow
Automated Web Scraping using Python + BeautifulSoup
Data Pipeline & Orchestration with Microsoft Fabric
Data Storage in Fabric Lakehouse
Dynamic Power BI Dashboard for Visual Analysis
Fully Automated Daily Data Refresh
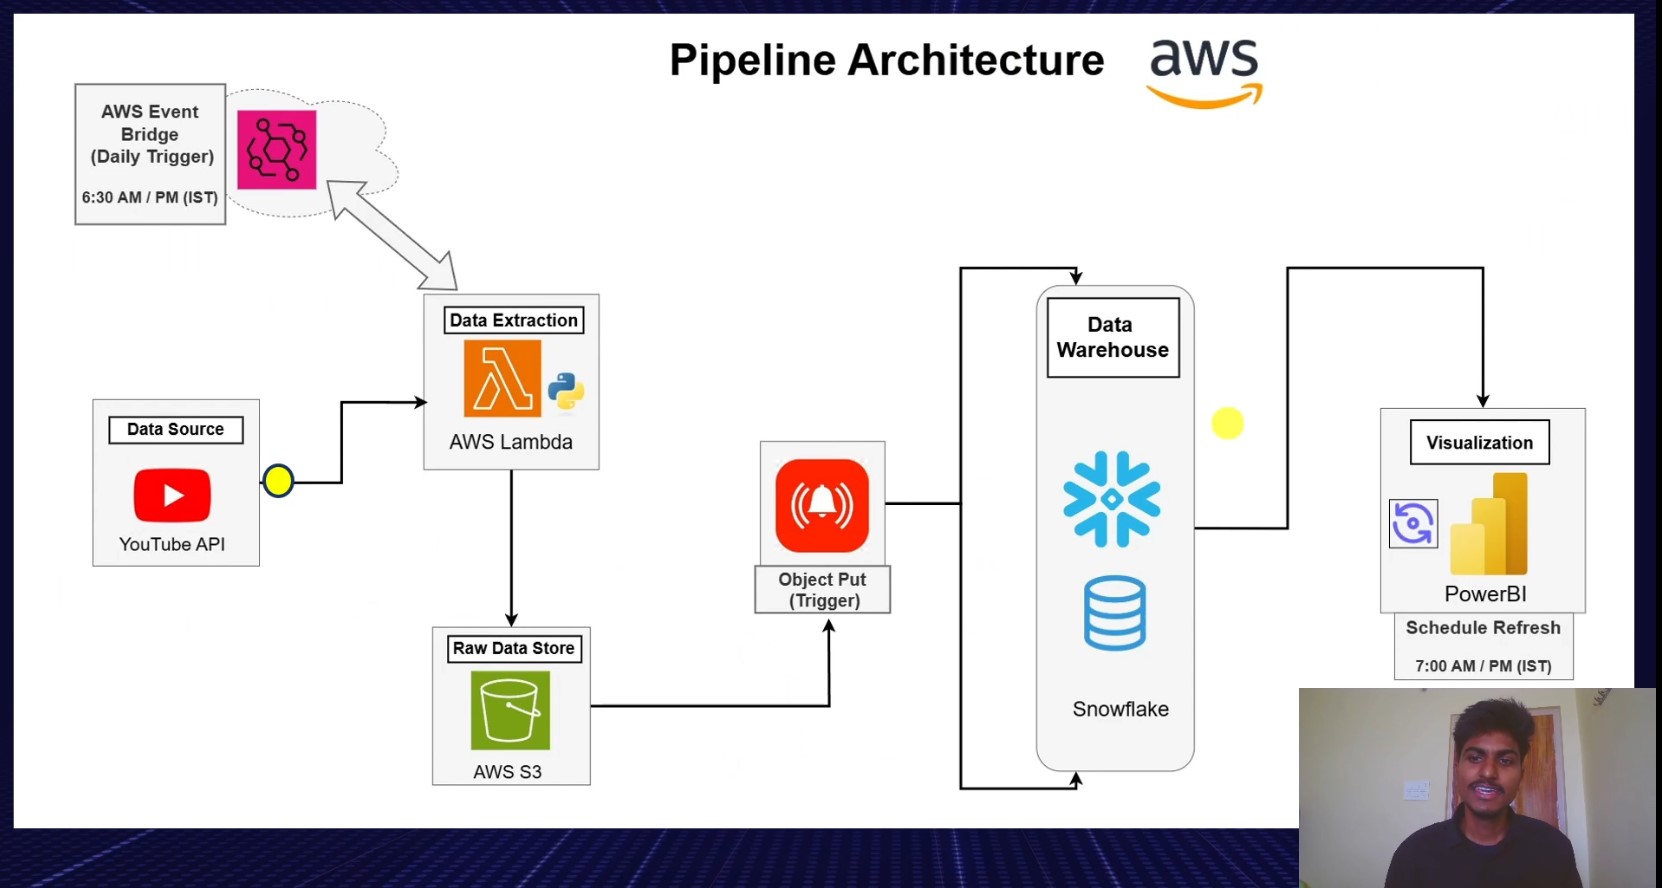
This project is an end-to-end data engineering solution for analyzing YouTube channels under the T-Series Universe. It automates data extraction, processing, warehousing, and visualization, providing deep insights into views, likes, comments, content duration, and top-performing videos. The final output is an interactive Power BI report, enabling users to analyze YouTube content trends over different time periods.
Automated Data Pipeline (Runs twice daily at 6:30 AM & 6:30 PM IST).
YouTube API Integration for real-time analytics.
AWS Lambda & EventBridge for serverless processing.
Time-based Trend Analysis (Daily, Weekly, Monthly stats).
Power BI Dynamic Filtering (By channel, content type, and date range).
Scalability – Can be extended to include more YouTube channels.
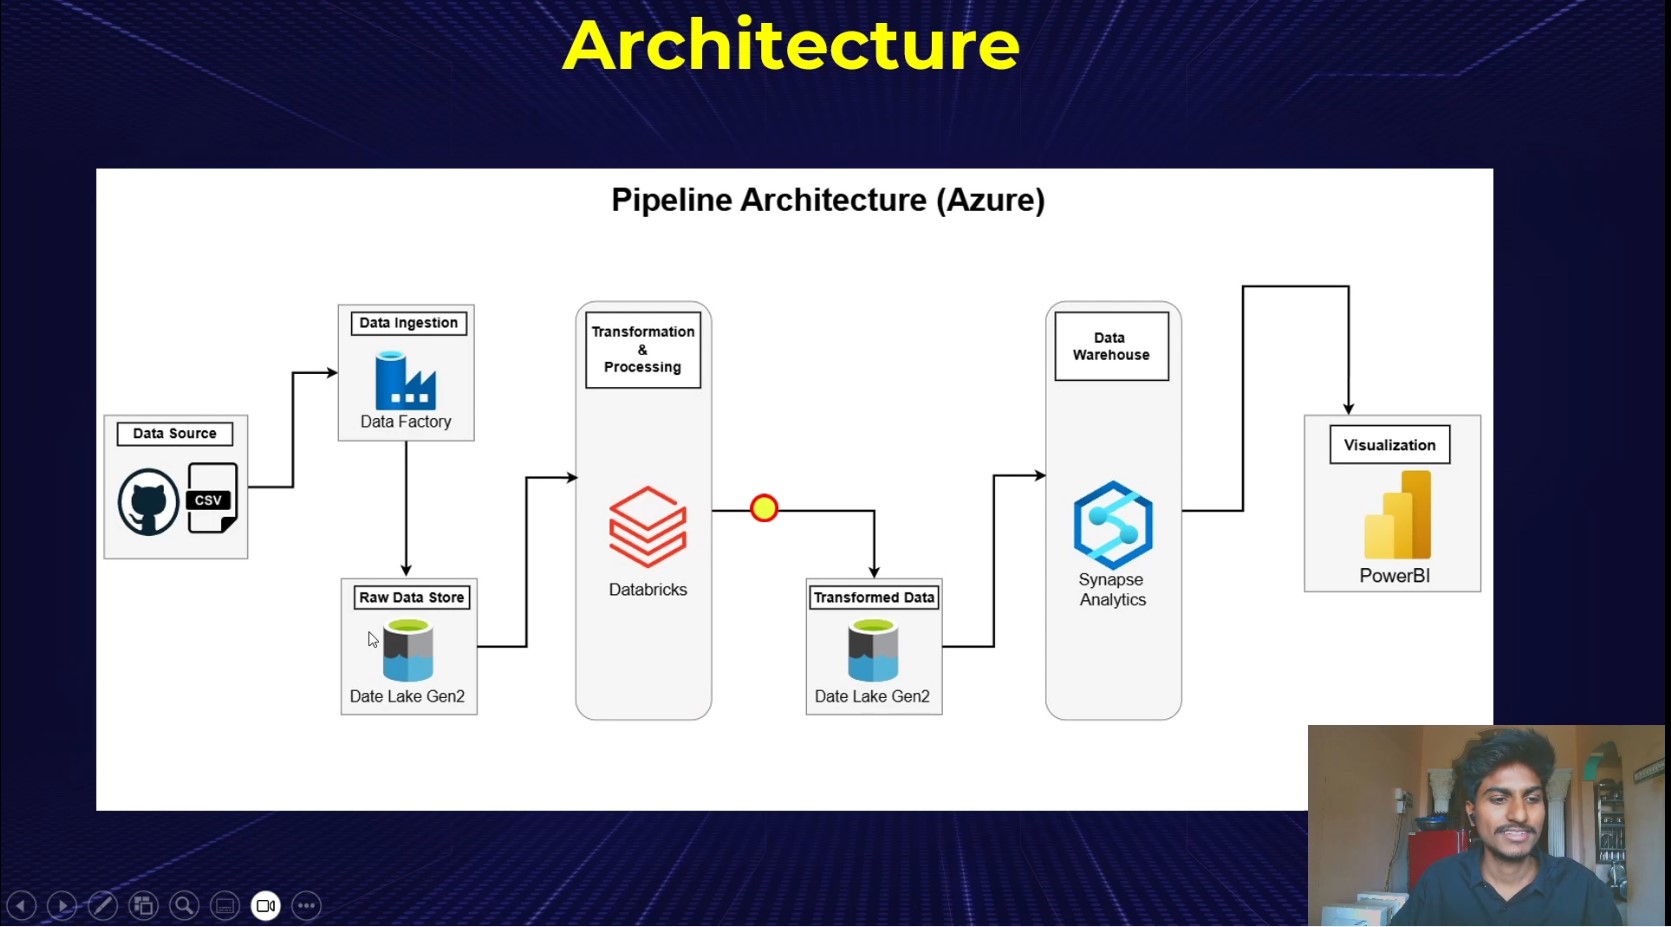
This project is an end-to-end data engineering solution to analyze the Tokyo Olympics 2021 data, sourced from Kaggle. The project leverages modern cloud tools for data storage, ingestion, processing, warehousing, and visualization. The final output is an interactive dashboard in Power BI, offering insights into the performance of the 2021 Tokyo Olympics.
Automated data ingestion from GitHub via Azure Data Factory
Scalable storage using Azure Data Lake Gen2
Data transformation with PySpark on Azure Databricks
Secure credential management using Azure Key Vault
Structured querying via Lake Database in Azure Synapse
Interactive dashboards built with Power BI
Parameterized, reusable data pipeline
Cloud-native, serverless, and cost-efficient architecture
Easily extendable to other sports/events
Feel free to get in touch with me. I am always open to discussing new projects, creative ideas or opportunities to be part of your visions.